I am interested in the impact of terrestrial and space weather on the Earth’s ionosphere and inner magnetosphere. In my PhD work, I have access to a fantastic dataset of global lightning activity from the World Wide Lightning Location Network (WWLLN), which I help maintain. I use this dataset–along with data from other instruments we build and deploy, or from existing networks and services–to study the impact of strong solar flares and particle events on radio wave propagation in the Earth-ionosphere waveguide, lightning-launched whistler-mode wave power density in the plasmasphere, and the contribution of global thunderstorms to the Earth’s Global Electric Circuit.
Impact of solar flares and energetic electron precipitation on VLF sferic propagation in the Earth-ionosphere waveguide


This project has two parts: an analysis of solar flare impact on lightning sferics detected/not detected by WWLLN; and a study of WWLLN’s ability to detect signatures of Energetic Electron Precipitation (EEP) in the lower ionosphere. Both solar flares and EEP alter the electron density profile of the ionosphere. Solar flares in particular enhance ionization, and therefore electron density, at low altitudes; driving the bottom-side ionosphere that forms the upper boundary of the Earth-ionosphere waveguide to lower altitude. Greater neutral atmosphere density at lower altitude means there is more attenuation from electron-neutral collisions, so VLF waves have a harder time propagating long distances through regions of the Earth-ionosphere waveguide impacted by a solar flare. Extreme solar flares increase VLF attenuation to such a degree that significantly fewer sferics are able to propagate through the subsolar region.
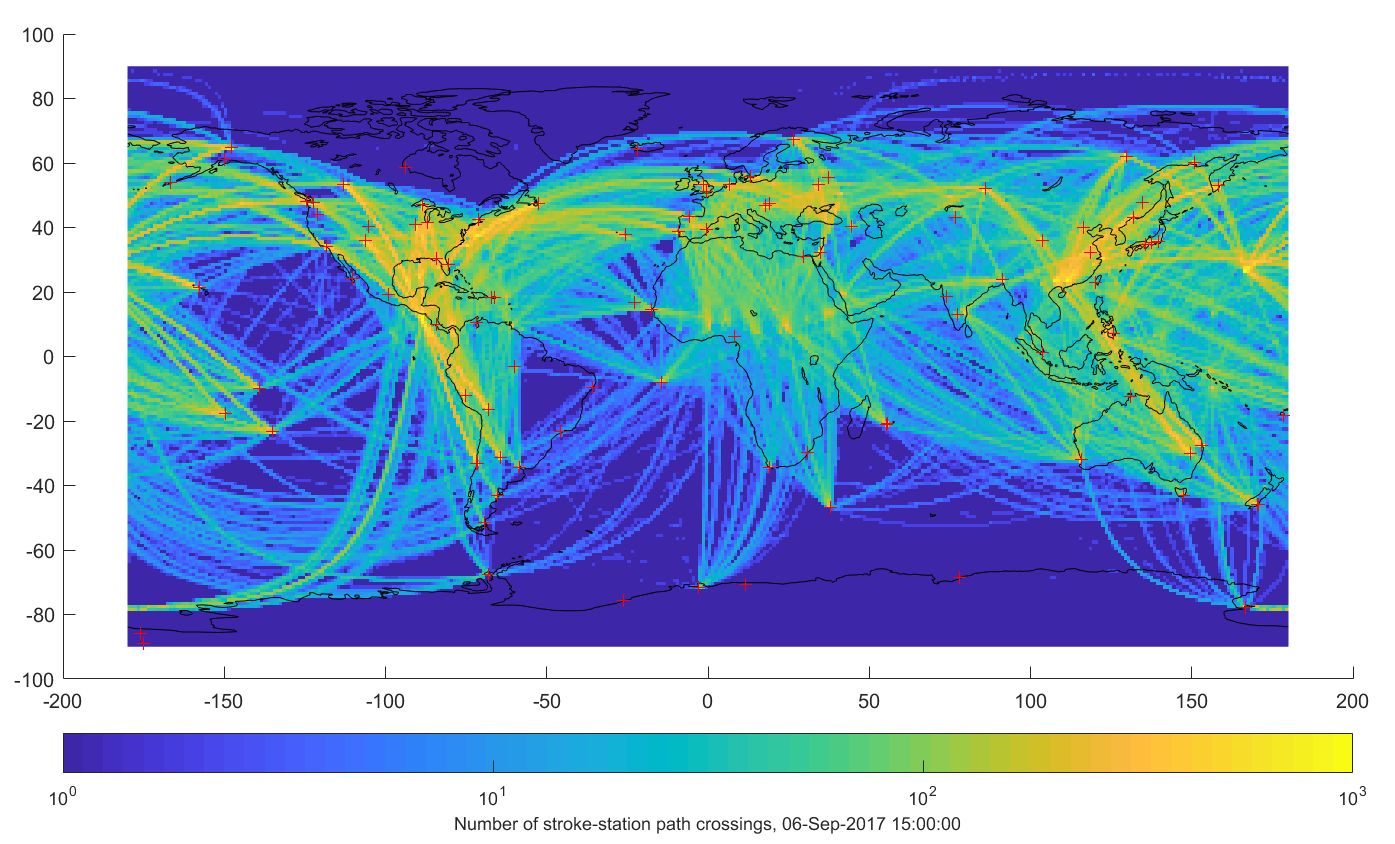
By assembling a distribution of propagation paths between lightning strokes and WWLLN stations, and observing how this distribution changes in time, we can look for changes in VLF propagation in the Earth-ionosphere waveguide when strong solar flares occur. In Anderson et al. 2020, we compared the difference in stroke-station path distribution with HF attenuation modeled by the NOAA D-Region Absorption Prediction (D-RAP) code for the X9.3 and X8.2 flares of September 6-10, 2017. This paper demonstrated that VLF attenuation associated with very powerful solar flares could be detected by looking only at the number of sferic propagation paths traversing a grid location, with no need to consider the amplitude or phase information of each sferic.
The impact of energetic electron precipitation (EEP) events on the lower ionosphere is less predictable in spatial and temporal extent than that of solar flares, and no measurement of the global energy and pitch angle distribution of EEP has yet been demonstrated. Since EEP impacts the ionosphere in the region where VLF wave reflection occurs, subionospheric VLF propagation techniques can be used to investigate EEP precipitation signatures. Previous work has looked at the impact of EEP on narrowband transmitter signals using networks of VLF receivers (e.g. AARDDVARK), but the spatial resolution of such networks is limited by relatively few transmitter-receiver pairs.
I am currently working on methods to quantify the spatial signatures of EEP using WWLLN wideband VLF sferics. Using lightning as a VLF signal source sacrifices very well-characterized sources in order to gain main more “transmitter”-receiver paths, and thereby potentially allow for significantly greater spatial resolution. This project has three components:
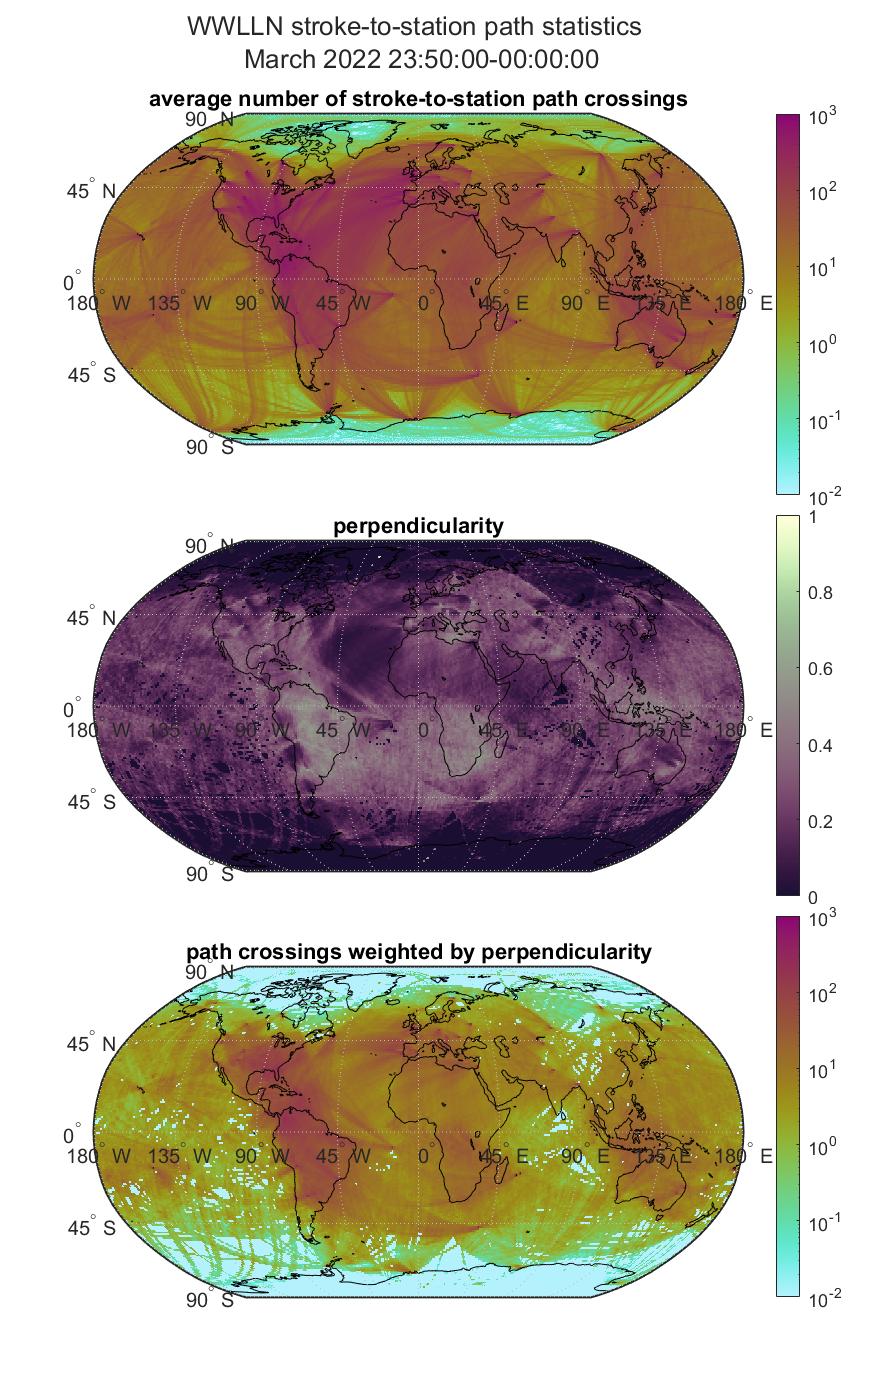
- Quantifying the global distribution of sferic propagation paths. This involves gridding paths, and calculating the average number of paths traversing each grid location, as well as azimuth statistics of path traversals. Since EEP at any point along a path will influence the measured sferic, perpendicular paths traversing each grid location are ideal for constraining the spatial extent of EEP in two horizontal dimensions. I will write up a more detailed explanation of WWLLN path density and “perpendicularity”, but for now you can see the UT-averaged path distribution for March 2022, its perpendicularity, and the perpendicularity-weighted paths in this set of animations.
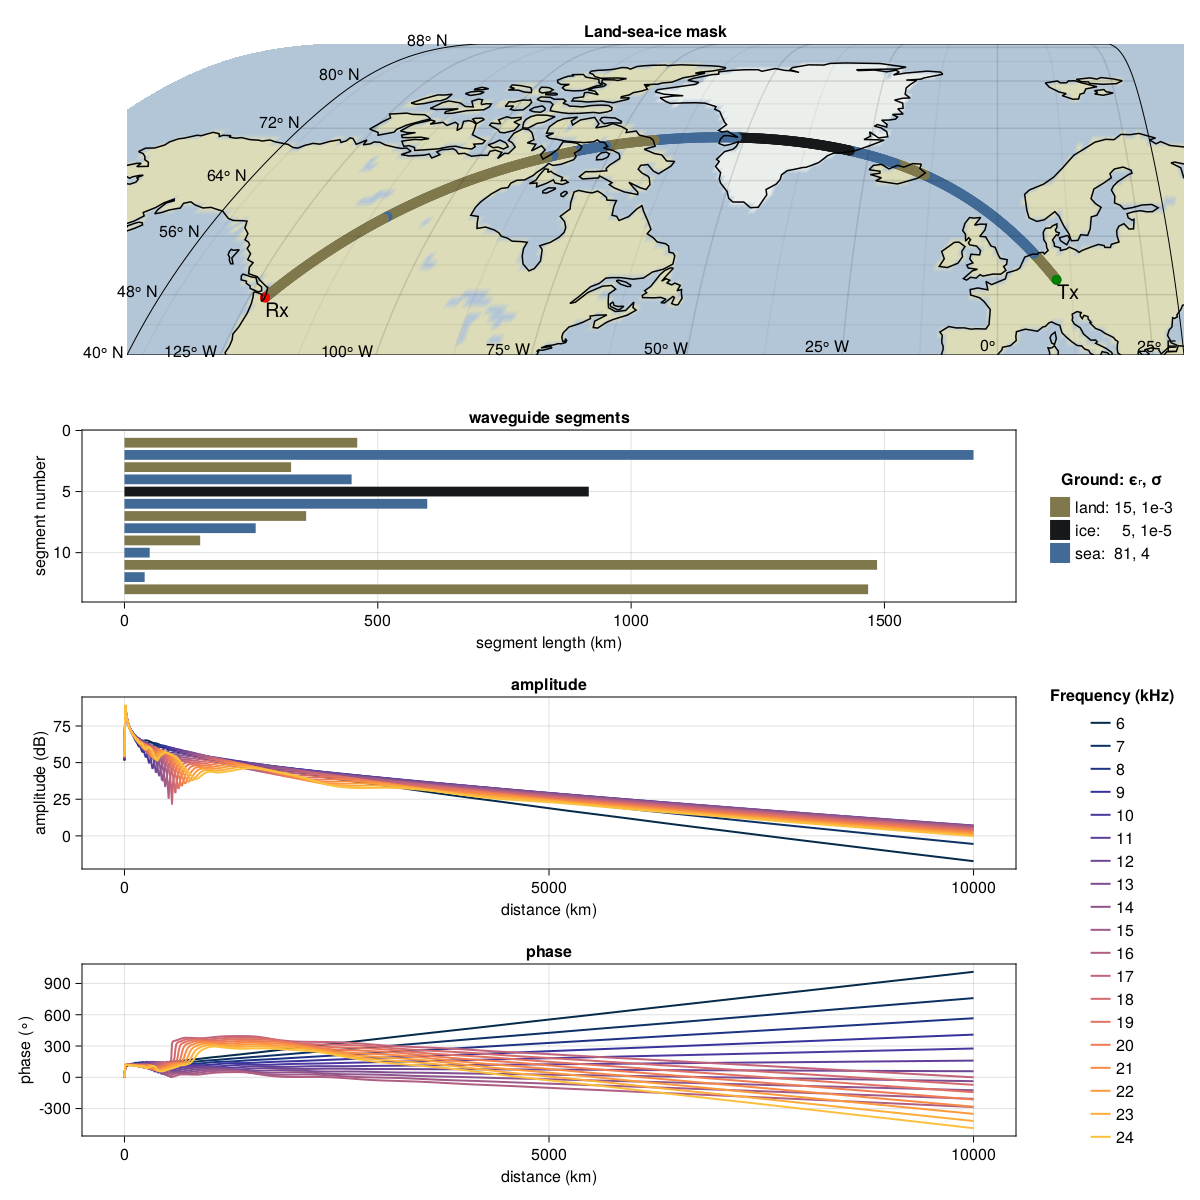
- Predicting measured sferic characteristics using a longwave propagator code. In order to better characterize lightning as a VLF source, I’m hoping to use Dr. Forrest Gasdia’s LongwaveModePropagator code to propagate wideband sferics along WWLLN propagation paths. By comparing sferics from a single lightning stroke measured at several WWLLN stations with modeled amplitude and phase, I hope to be able to better determine which sferics were impacted by EEP. This work is still in its early stages, but you can see an example propagation model for a 6-24 kHz sferic here.
- Determining the sensitivity of WWLLN sferics to known EEP events. In order to determine how many sferics are needed along each path to measure the spatial extent of EEP signatures, I will compare sferics measured by several stations during known EEP events, as well as during undisturbed periods.
You can find a more detailed description of the solar flare methods in the above-mentioned paper, and MATLAB code in my pathGrid repository.
Quantifying the thunderstorm contribution to the Global Electric Circuit
Thunderstorms were hypothesized to be the principal driver of the Global Electric Circuit (GEC) nearly 100 years ago by C. T. R. Wilson (1921), but testing this hypothesis has proved difficult due to difficulty in measuring the relative contributions to the GEC of various sources: namely, thunderstorms, electrified shower clouds, and other middle-atmosphere current sources (Williams E. , 2009). This work seeks to quantify the thunderstorm contribution to the GEC by combining two measurement schemes:
- A stratospheric balloon campaign, whose payloads will measure vector electric field and electrical conductivity in the fair-weather atmosphere, from which the fair-weather return current of the GEC can be derived, and
- A study of global thunderstorm area determined by the World Wide Lightning Location Network (WWLLN), with correction from satellite lightning and cloud imagery.
A test balloon flight was conducted in early September 2019, wherein one payload flew for 31 hours and produced 18.5 hours of usable electric field and conductivity data. These data were presented in a talk at the 2019 AGU Fall Meeting. Two science flights were conducted in June 2021. These balloons were launched about two days apart in order to ensure >300 km spacing between them, and simultaneously gathered data in the stratosphere for about two days. Results from the science flights, and a comparison with several different estimates of global thunderstorm activity during the balloon measurement time, were presented at the 2021 AGU Fall Meeting.
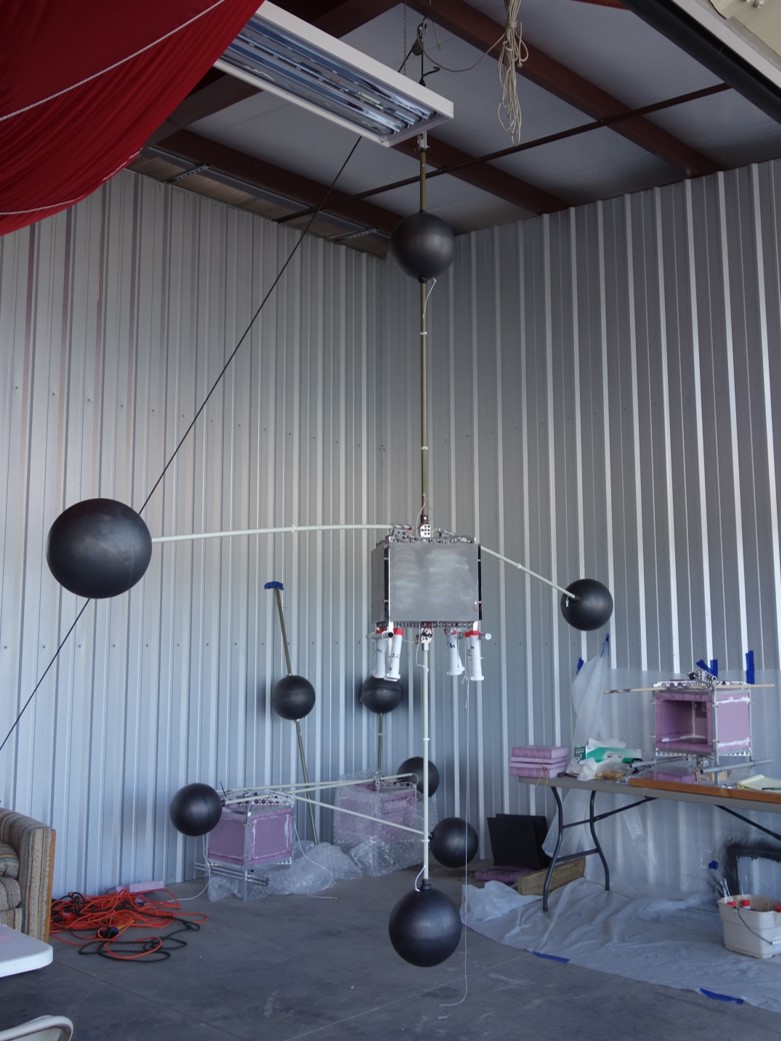
In the banner photo of this page, you can see one of the stratospheric balloon payloads being tested in Sisters, OR, in September 2019. The tiny white speck above the payload’s boom on the right side of the image is the balloon flown during the test flight, catching the last rays of sunlight.
Whistler wave power density in the magnetosphere from global lightning
October 2022: this project is on hold until I finish my dissertation! The aim of this project is to get an idea of how lightning-generated whistler waves impact different particle populations in the magnetosphere; and also, to practice developing ray-tracing code and to further my own understand of magnetospheric whistler wave propagation. Much work has gone into ray-tracing of whistler wave paths in the inner magnetosphere in recent decades, although usually the aim is to correlate satellite observations of particular wave or particle events with specific lightning strokes or other whistler sources. Here, we will calculate ray paths for all lightning strokes observed in the by WWLLN, and thereby model whistler wave power density from lightning strokes in the magnetosphere. Additionally, Holzworth et al. 2021 found that high-latitude lightning is increasing as a proportion of total lightning; how might this change in lightning climatology impact plasma in the magnetotail?
This project is in its early stages, and is roughly composed of three parts:
- modeling wave propagation from a lightning stroke to the top of the ionosphere
- ray-tracing waves from the top of the ionosphere into the magnetosphere
- modeling wave-particle interactions and energy loss
As of May 2021, individual ray paths can be traced from the top of the ionosphere (~1000 km altitude) into the magnetosphere, using Haselgrove’s equations. This ray tracer can be found in the ray-trace repository. I am enjoying using the Julia language for this project, because of its combination of development speed and runtime efficiency.